

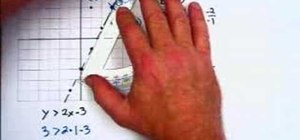
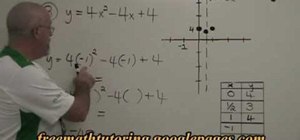
In this video the instructor shows how to graph linear inequalities. A linear in a equation is almost similar to a linear equation except for the sign in the equation. Now treat the in equation as a linear equation and graph the line. So substitute the lesser than or greater than symbol in the liner in equation with the equals to sign and graph the equation. Find the slope of the equation and identify the points that the line passes through. Now take a point on the either side of the pointed line and substitute in the original equation. If it does not meet the requirement of the original equation try an other point on the line. If it satisfies the equation it means the lines satisfies the inequality. Similarly try a point on the other side of the line. If it satisfies this means that this area satisfies the equation and is the solution to the system. This video shows how to graph a liner inequality.
Just updated your iPhone? You'll find new emoji, enhanced security, podcast transcripts, Apple Cash virtual numbers, and other useful features. There are even new additions hidden within Safari. Find out what's new and changed on your iPhone with the iOS 17.4 update.


Be the First to Comment
Share Your Thoughts